


4/10/23 Weekly Plan + Daily Plan
4/10/23 Weekly Plan + Daily Plan
economy on the decline: The effects of slowing growth

- Good morning Traders
Let’s begin this weekly plan by first covering my Intraday LONGS and SHORTS watchlist and then further diving into this weeks macroeconomics.
Intraday LONG and SHORT Watchlist:
E-mini S&P 500 (/ES): Before getting into E-mini levels I highly recommend you read the entire weekly plan to further understand my analysis for this weeks intraday plan. As stated we have massive support below at 4101. Futures now trading at 4107. For my LONG position want to test for continuation higher for and entry at 4112 → Target 4121, T2 4130. For my SHORT I will be waiting for a test below 4100 for entry to target 4053, T2 3960
Gold Futures (/GC): Called the pullback in last daily plan plan for an amazing run, now let’s see if we can repeat it. Looking at the 3 Y 1D chart we can see that we’re starting to trek down lower back into to some trading value areas right around 2006. Very Very unlikely IMO but for my LONG I would like and entry at 2006 if we hold above this level IB and target back into highs at 2081. For my SHORT I’m liking entry below 2000.3 → 1985.9
Crude Oil Futures (/CL): After last weeks massive gap now trading at 80.47. For my SHORT I’m liking below 79.70 → 78.27, T2 77.49. For LONG above 80.6 → 82.62
TSLA 0.00%↑ : Now trading at 179.50 Pre-market. SHORT 178.7 → 173.03. LONG 182 → 188.6
NVDA 0.00%↑ : LONG above 270.7 → 274.09, T2 → 280. SHORT below 268.6 → 264.36 → 258.96
AMD 0.00%↑ : Think if AMD can trade below 91.36 can SHORT here to target → 88.4. LONG above 92.93 → 95.39
INTC 0.00%↑ : SHORT 32.52 → 31, T2 → 31.27. LONG 32.81 → 33.80
GOOGL 0.00%↑ : LONG 106.7 → 108.22 → 109.19. SHORT failure to test higher at 107.86 → 106.04
AAPL 0.00%↑ : LONG 161.32 → 162.67. SHORT 160.99 → 159.97, T2 → 159.35
AMZN 0.00%↑ : LONG 99.50 → 100.72. SHORT continuation lower below 99.65 → 98.45
MSFT 0.00%↑ : Think if MSFT breaks below 287 today can see test of POC at 284.02. SHORT 287 → 284.02 POC T2 → 282.77. LONG 285.56 → 287.19
META 0.00%↑ : Want to SHORT in anticipation of continuation lower. SHORT 211.5 → 208.6. LONG bounce at 211 if we fail to go lower back to HVN 214
Moving on to the macroeconomics side of things, credit conditions are tightening particularly for small firms. Chart A below shows us that consumer have experienced a tightening in credit conditions with adequate signs of relief, This is mainly a factor in larger firms since they usually have more resources available to get credit. So what does this all mean and what does it tell us?
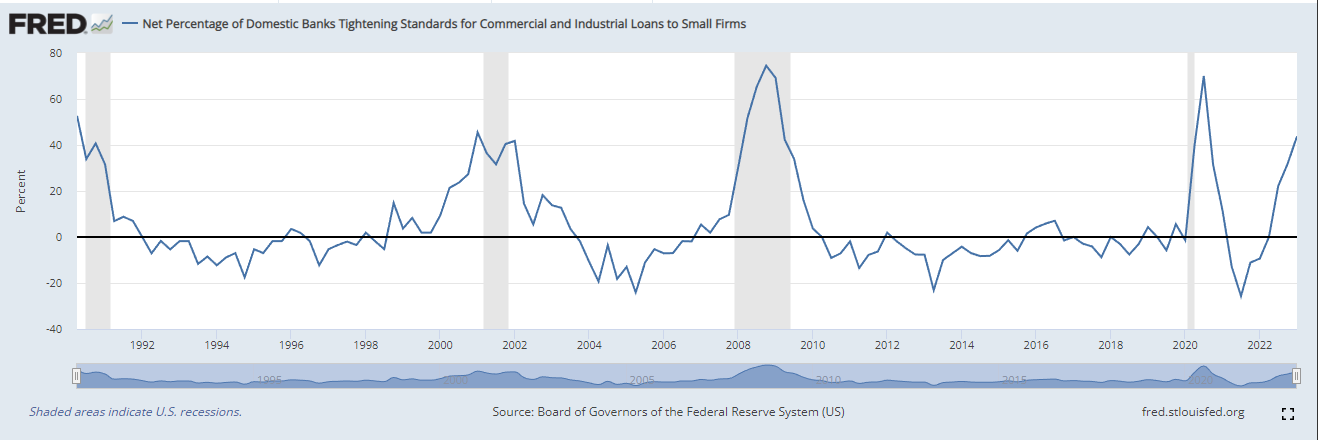
This tells us, it tells us that there is going to be more and more slowing in the economy. This applies to demand in hiring, We’re going to see a higher probability for businesses shuttering demand or businesses shutting down all together.
This is something that leads to higher unemployment. It is often when there is a big tightening of credit conditions; because we are driven in a debt driven economy, you do see slowing in the economy and ultimately an upcoming a recession. The tightening of credit conditions is likely anywhere from over.
Think about it even if its possible for much smaller firms to attain credit they will get screwed. When they apply for these revolving lines of credit it puts them at the mercy of interest rates which as we all know for the last year has been unforgiving. So to summarize even if these small firms are able to attain credit they’re paying allot more for it as well. This is important because even though it’s called “small businesses”, small businesses are the engine of employment growth in the US. If this isn’t doing well the economy as a whole is not doing well. So we need to keep a close eye on this. This is something Powell has spoken about several times
Analyzing the Factors Behind the Significant Drop in US Bank Lending
Bank lending continues to drop dramatically, it fell a record low of 104.7B. So the last few weekly plans we covered how the market sentiment was believing that this phase of the market could be due to another round of QE the reality is beginning to look allot different. we’re seeing liquidity outflow in the system, we’re seeing bank credit tighten and less lending into the economy. This is all pointing to signs of economic slowing.
State and local governments are finding it harder and harder to allocate capital and if they are able to attain capital it’s much more expensive. All this points to a greater picture where there will be a huge slow down if not finally confirming this ‘invisible recession’ we’ve been in that everyone’s been denying.
JOLTS
Delving in further we can also see that JOLTS took a turn for the worst. This data suggest that the amount of job openings that were are seeing right now are still high but it also tells us that this is slowing. Allot of the jobs that were there are no longer there. While NFP (Non Farm payrolls) are pretty strong Vs. what the data is telling us that there is a tightness in the labor market. This is good for inflation but it also means a slowing economy.
Correlation with CPI and OIL
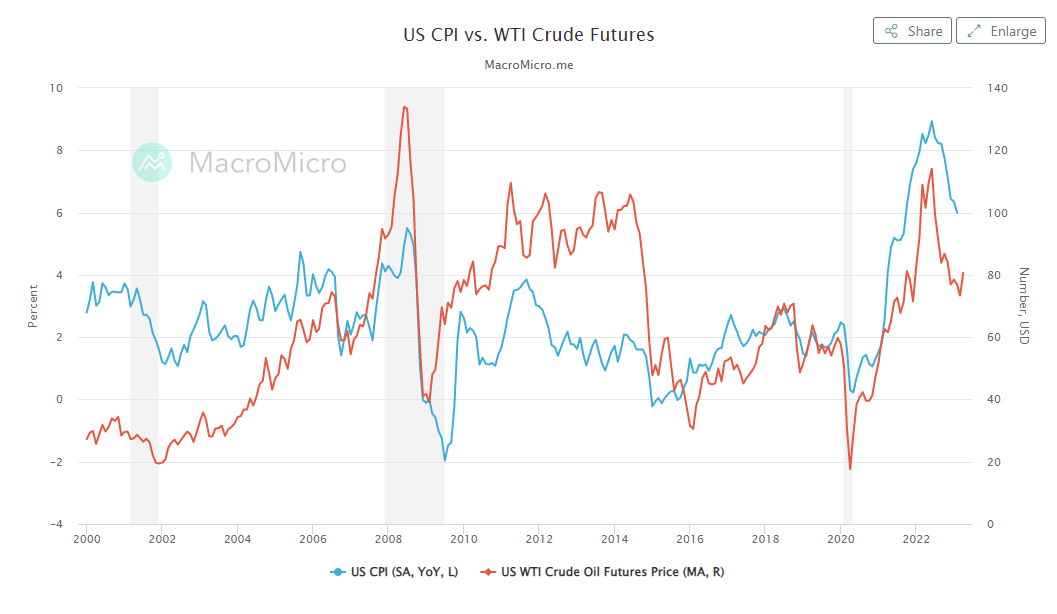
Looking at this chart B above we begin to see that there is reasonable correlation with Oil and CPI data. With Oil breaking above $80/Barrel we may see some of the relief in CPI begin to reverse. Also looking at Gasoline it did not get the memo that it was meant to go down when Oil fell to around 65 bucks a barrel. Gas has held it’s support and is now making a more recent high as oil resumes after its oil cuts. Before a thought experiment with me and take the time to think how much oil effects our economy. I know America has an on running gag loving its oil but think for a sec. Almost everything ties into the price of oil. The machines used to keep up with agriculture require oil, then transportation, construction, plastics. It’s just sort of in everything. Oil has its ways of making it into every nook and cranny in the market.
As the price of oil begins to resume this up ticking trend, this will be a rather bad sign for the overall economy. Should we see OPEC country keep the price of oil above $70 a barrel that’s going to affect the goods driven and service driven inflation higher than what optimal for the fed to handle.
Continuing chip crisis
Now I believe I’ve covered this topic briefly but the idea is very forward facing and potentially massive. US Air Mobility Command Head General Mike Minihan has stated in that past to suspect China to invade Taiwan by the year 2027 as early as 2024. As you come to read these articles you will come to learn that I love asking questions that will get you to think. If Taiwan were to be invaded and they’re also known to be the top producers of semiconductors what will happen when this supply is cut from the market?
The second competitor will take over and that’s Americas INTC 0.00%↑
Now looking over to Samsung. Samsung’s chip business may expect to report a loss in first quarter of up to 96% drop in their earnings. This is because they are having an abundant supply of chip. They’re having to mark them down because they didn’t slow their manufacturing and now having a problem trying to find the demand for the chips and this have left them in a very slippery position.
We’ll have to keep an eye on all this information’s and what this could mean for the leading implications for semiconductor. Personally I see allot of fluff in the semiconductor for right now. We need major events like I stated above to have a legitimate reason for semiconductor stocks like NVDA, AMD and INTC to be running this much. These rallies that we’ve have been seeing in semiconductors would be seen in an economy that is expanding, instead these are leading sectors that should not be bid up as much as they are now.
This doesn’t mean that the market will stop or begin acting rational or irrational that’s just what the market does. What this does mean however is that these semiconductors are becoming a better and more appealing short opportunity.
This earning will give us a peak into what’s happening in this dramatic slow down across the market in semiconductor business. Even looking into other semiconductors like micron they suggest that their revenue has dropped around 50%. Huge opportunity that will become more attractive with time. Especially when you look at Korea’s chip exports are the worst they’ve ever been. Does this pricing make sense?
What are my E-mini Levels for this week?
As always first thing I like to do when collecting my market data is observing the big picture. Where are our support, resistance and POC. Looking back on the 3 Y 1D I stated in last weeks weekly plan that the market has been trading within a range of 3830-4180 since back in Jun 10th 2022. Last week we failed to get over very heavy resistance located at 4170 and sold of lower. With all that being said let’s cover the scenarios I see playing out this week:
Scenario 1: This week I think 4100 level will play a big roll for this weeks levels. Precisely around 4101 is the bottom of our LVN and will act as our breakout support for my SHORT position down to target 3965 and for our aggressive target (Incase you are unaware T2 are always aggressive targets) T2 will be 3837.

Scenario 2: IF E-mini fails to push any lower below 4101 and weakness is developed we can see support come into play around 4070 where E-mini can then target HVN 4180. 4200 is massive if you don't know why please re-read past daily plans and weekly plans.
That concludes today's Intraday levels. Please feel free to leave a comment and let me know your thoughts on the longer format for intraday long and short levels. Additionally, if you found this article helpful, please don't forget to hit the like button. And if you haven't already, be sure to subscribe so that you never miss a post.
-Gatsby
Disclaimer: Please note that the following post is for informational purposes only and should not be considered as investment or trading advice. The views expressed in this post are solely my personal opinions and should not be taken as fact. Trading in stocks, bonds, and futures carries a high level of risk and there is no guarantee of any profit. You may even face the possibility of losing all your invested funds, so extreme caution should be exercised. The authors, representatives, principals, moderators, and members of this newsletter are not registered as securities brokers or investment advisors with the SEC, CFTC, or any other securities regulatory body. It is recommended to seek the advice of a registered investment advisor, broker, or financial advisor before making any investment decisions. By reading and using this newsletter or any of my publications, you agree to these terms. The screenshots in this post are provided by Ninja Trader, Think or Swim, and/or TradingView and I have no affiliation with these entities.